Are you looking for a tool to visualize, inspect and control your apps from a simple desktop interface? Flipper has it all. Many React Native engineers are using it as their first choice for debugging apps as it has many good features that will improve the development process. If you haven’t jumped on the Flipper bandwagon yet and frequently work with React Native framework, discover all the basics about the tool, its features, and, most importantly, how to use it.
Debugging is very important, especially when you are developing mobile apps. In this case, you often need to log messages, look out for device crashing, inspect network requests, and similar. However, Flipper is handy in this case, as it helps you debug apps running in an emulator/simulator or between connected physical devices.
About Flipper
As mentioned, Flipper is a platform for debugging iOS, Android and React Native apps. Since React Native 0.62 release, it has been included in any React Native app by default. It consists of two parts:
1. The Desktop app
2. Native mobile SDK
The two parts are open-source and MIT-licensed. They communicate through a WebSocket connection, send data back and forth and listen for events on the mobile app.
It's worth pointing out that Flipper only provides the architectural platform. What makes it worthwhile are the plugins built on top of it, such as Logs, Layout Inspector and Network Inspector. Furthermore, since it is a platform, you can always extend the capabilities of Flipper by building a new plugin. For example, see how to make a React Native Plugin here.
How To Use It?
Starting with React Native 0.62, the Flipper integration is ready for debugging builds after generating your project with react-native init. So, there is no need for extra package installations in your project.
Note: If you are using expo, skip to the “Using Expo” section.
- First, install the Flipper desktop app for macOS, Windows, or Linux.
- After successful installation, start the Flipper desktop app.
- Android - start your project by running
npm run androidand then Flipper will show up in your application - IOS - run
pod installonce in theiOSdirectory. After that, runnpm run iosin the root directory, and Flipper will appear in your application.
When finishing, you will see “App Inspect” on the top left side of the desktop app. There you can choose an application you want to debug. On the left side, you will have a bunch of default plugins installed and ready to use.
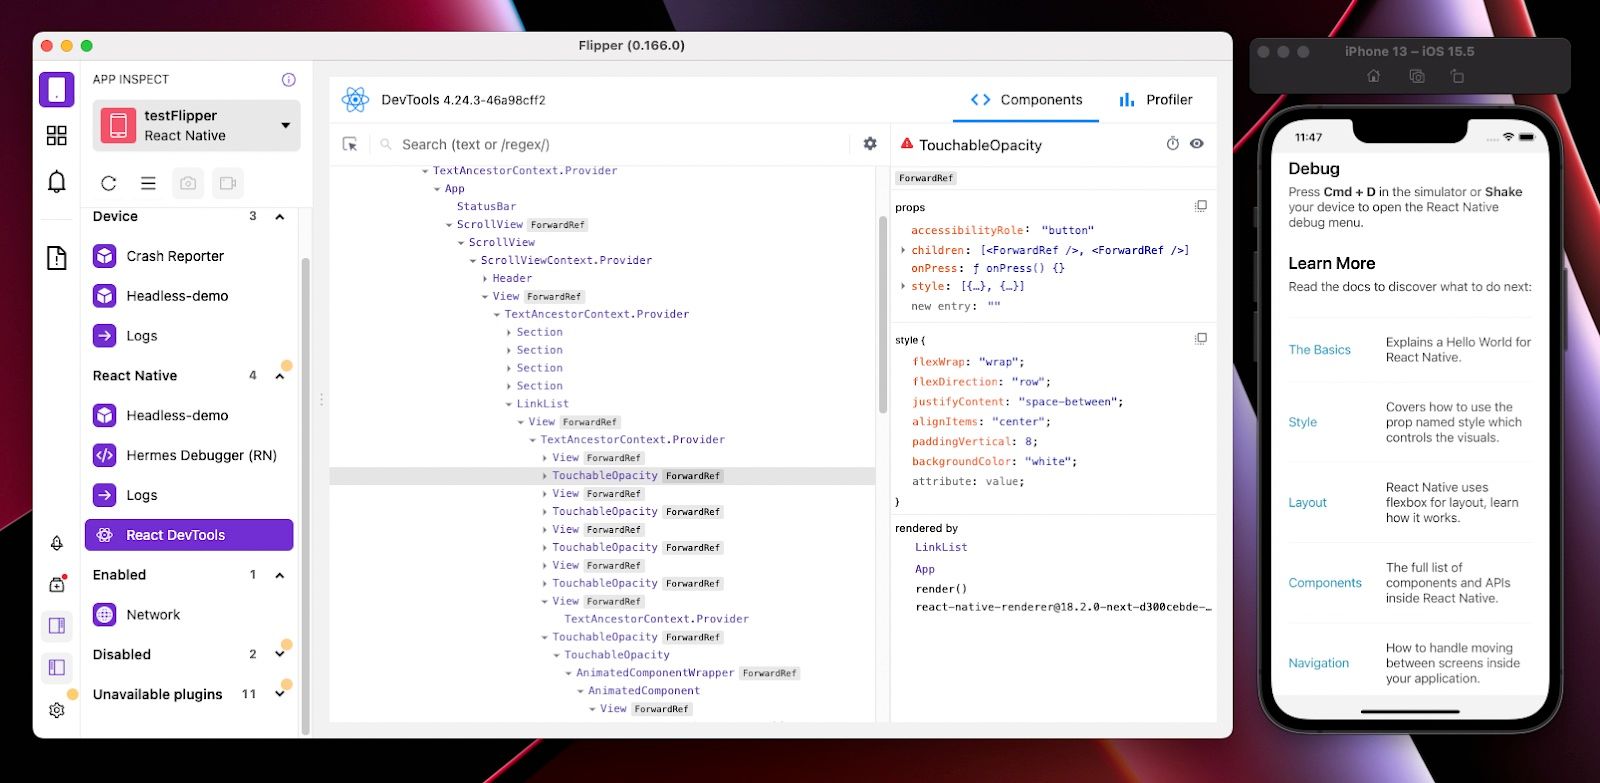
In the example above, we are using React DevTools plugin that comes pre-installed. As you can see, we are inspecting the Component’s Tree, watching their props, and even adding new props from the Desktop app. It is a handy plugin. For example, you can use it to change the style; the adjustment will show immediately in your app.
Moreover, it will also enable you to debug multiple devices or emulators at the same time.
Are you still working on your developing skills? Join the next session of Povio Software Engineering Academy to get your IT career to the right start.
Always Use the Latest Version
By default, React Native might ship with an outdated Flipper SDK. This is an optional step. However, to ensure that you are using the latest version, check your current version by running the npm info flipper at the root of your project.
Android
1. Go to android/gradle.properties and change the FLIPPER_VERSION variable, for example, FLIPPER_VERSION=0.167.0; if you don’t see any variable with that name, then add a new one.
2. Run ./gradlew clean in the android directory.
IOS
1. Change Flipper version
For react-native >= 0.69.0:
- In
ios/PodfilecallFlipperConfiguration.enabledwith a specific version, for example:flipper_configuration => FlipperConfiguration.enabled(["Debug"],{ 'Flipper' => '0.159.0' })
For react-native < 0.69.0:
- In
ios/Podfilecalluse_flipperwith a specific version, for exampleuse_flipper!({‘Flipper’ => ‘0.167.0’})
2. Run pod install --repo-update in the ios directory.
Using Expo
Expo is a great tool for building React Native apps and is very popular in the community. Why?
Before Expo SDK 0.43, you couldn’t use Flipper in the managed workflow. Since >= 0.43 Expo, it includes React Native 0.63 and Flipper is available by default.
Note: We will be using EAS for making builds and we expect that you already have EAS-CLI installed and configured. If not, then follow the instructions here.
- Go to your root directory and run:
npx expo install react-native-flipper react-devtools-core. Also, for expo-related code, runnpm install expo-community-flipper. - Connect your app to Flipper in our App.tsx file :
// App.tsx
import { connectToDevTools } from "react-devtools-core";
if (__DEV__) {
  connectToDevTools({
    host: "localhost",
    port: 8097,
  });
}- Since we’ve added a new native module, the expo-community-flipper package before, we need to add it inside expo.plugins. Go to app.json :
{
 "expo": {
   // ...
   "plugins": ["expo-community-flipper"]
}- Now, go to eas.json file and create a new devClient profile:
{
  "build": {
    // ...
    "devclient": {
      “env”:{},
      "releaseChannel": "default",
      "distribution": "internal",
      "developmentClient": true,
      "android": {
        "buildType": "apk"
      },
      "ios": {
        "simulator": true
      }
    }
  }
}- Run
npx eas build --profile=devclientto create a build and wait until it finishes running. - After successfully building, go to Expo Dev at the builds section and download your app in your emulator/simulator.
- Now you are ready to debug your expo app, run your app with –dev-client flag:
nxp expo start --dev-client
You should do all these steps only once. Therefore, after you configure the devClient profile in eas.json and connect your app to Flipper, you have to run your app with a custom flag, as we mentioned above. Then, our app will be shown on the Flipper desktop as any React Native app.
Features
As you saw, there is no additional effort to use Flipper on one side. For bare React Native, you just install the Flipper Desktop, and for the expo, just follow the steps above once.
On the other, many features make this tool great. One of the main ones, very important in mobile development, is that Flipper uses “direct” debugging instead of remote debugging.
Remote Debugging
First, we need to explain remote debugging and how it works before trying to understand “direct” debugging.
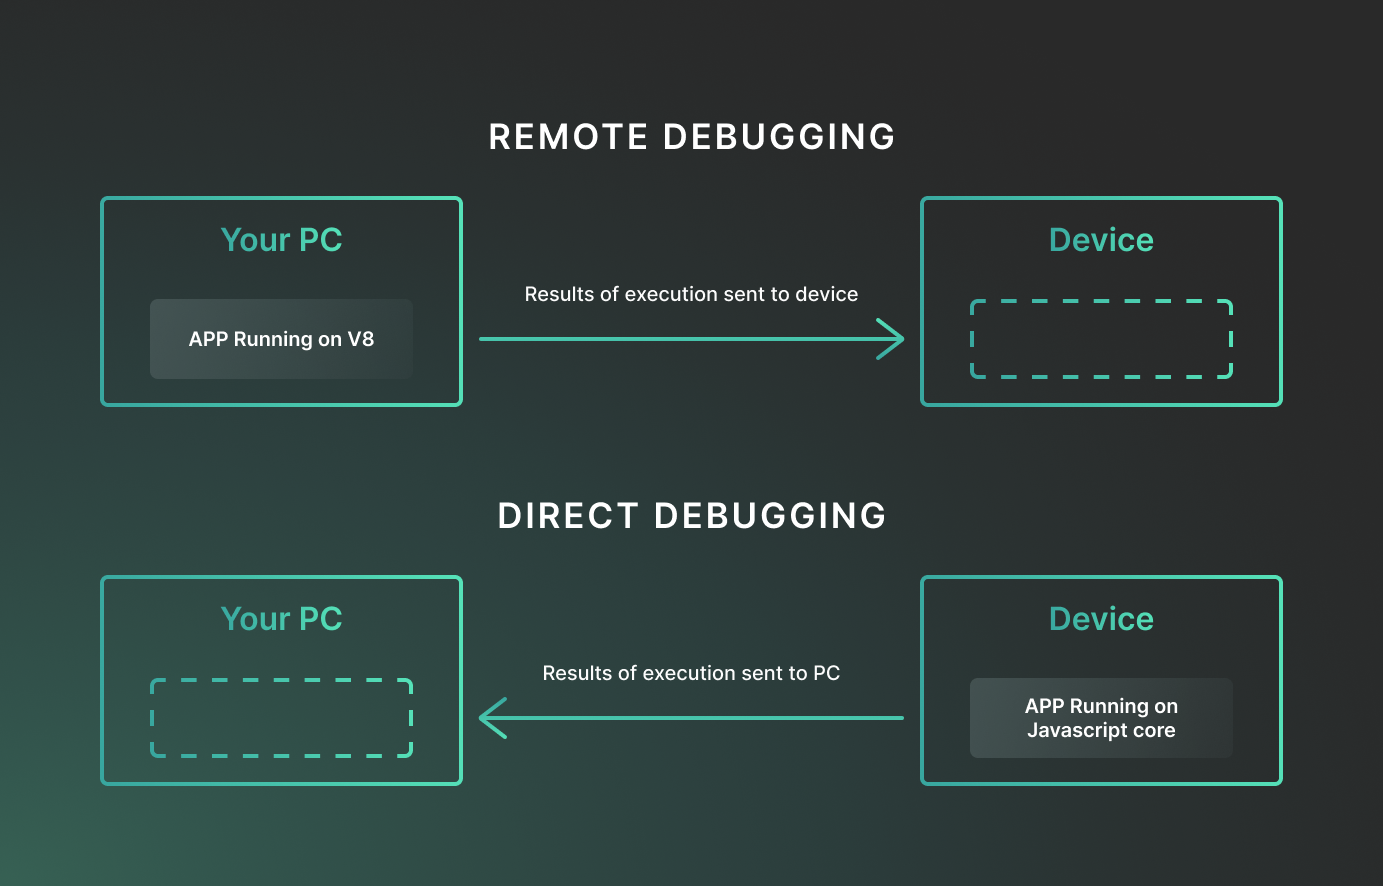
Overall the way remote debugging works is quite simple. We just move the execution of our JS code to a different engine. Therefore, instead of using JavascriptCore (which is the default RN JS engine), we would run our JS in Chrome (V8). We would send all commands from JS <-> Native over the web socket connection.
It sounds like a good way of debugging, but since our JS code is running in an engine that our end users will not use, it can be very risky. Sooner or later, there will be a bug that didn’t show up in the debugging process and maybe it will also be shipped to production.
“Direct” Debugging
Direct debugging means that all the JS code runs on your device/simulator and not in a different engine. Compared to remote debugging, which slows down your app, because JS code communicates to the native code with Web Socket, Flipper runs your code in your default JS engine and uses Web sockets to send data to the Flipper desktop app.
There’s a clear difference between remote and direct debugging. However, to make it easier to understand here’s a simple example in a picture.
Flipper Plugins
Flipper includes some tools you’ll find handy by default. The main ones are:
- Network - It provides the Network Inspector, which inspects outgoing network traffic in your apps. You can easily browse all requests being made and their responses. The plugin also supports zipped responses. The Network plugin is very similar to the Network tool in Chrome.
- Logs - It shows device logs without any additional setup, which combines console.log, and native log(ADB, IDB). This is a device plugin, meaning it's not tied to any specific app and no additional setup is needed to see the logs.
- React DevTools - This allows you to inspect the Components' hierarchy and their props and add new props directly from the Desktop app. It is the same as React DevTools Chrome extension.
- Hermes Debugger - Hermes is an open-source JavaScript engine optimized for React Native. If you have enabled Hermes in your project, you can debug your app with this plugin.
- Crash Reporter - The Crash Reporter Plugin shows a notification in Flipper whenever an app crashes. You can click on the notification to see crash information, such as stack trace and other metadata.
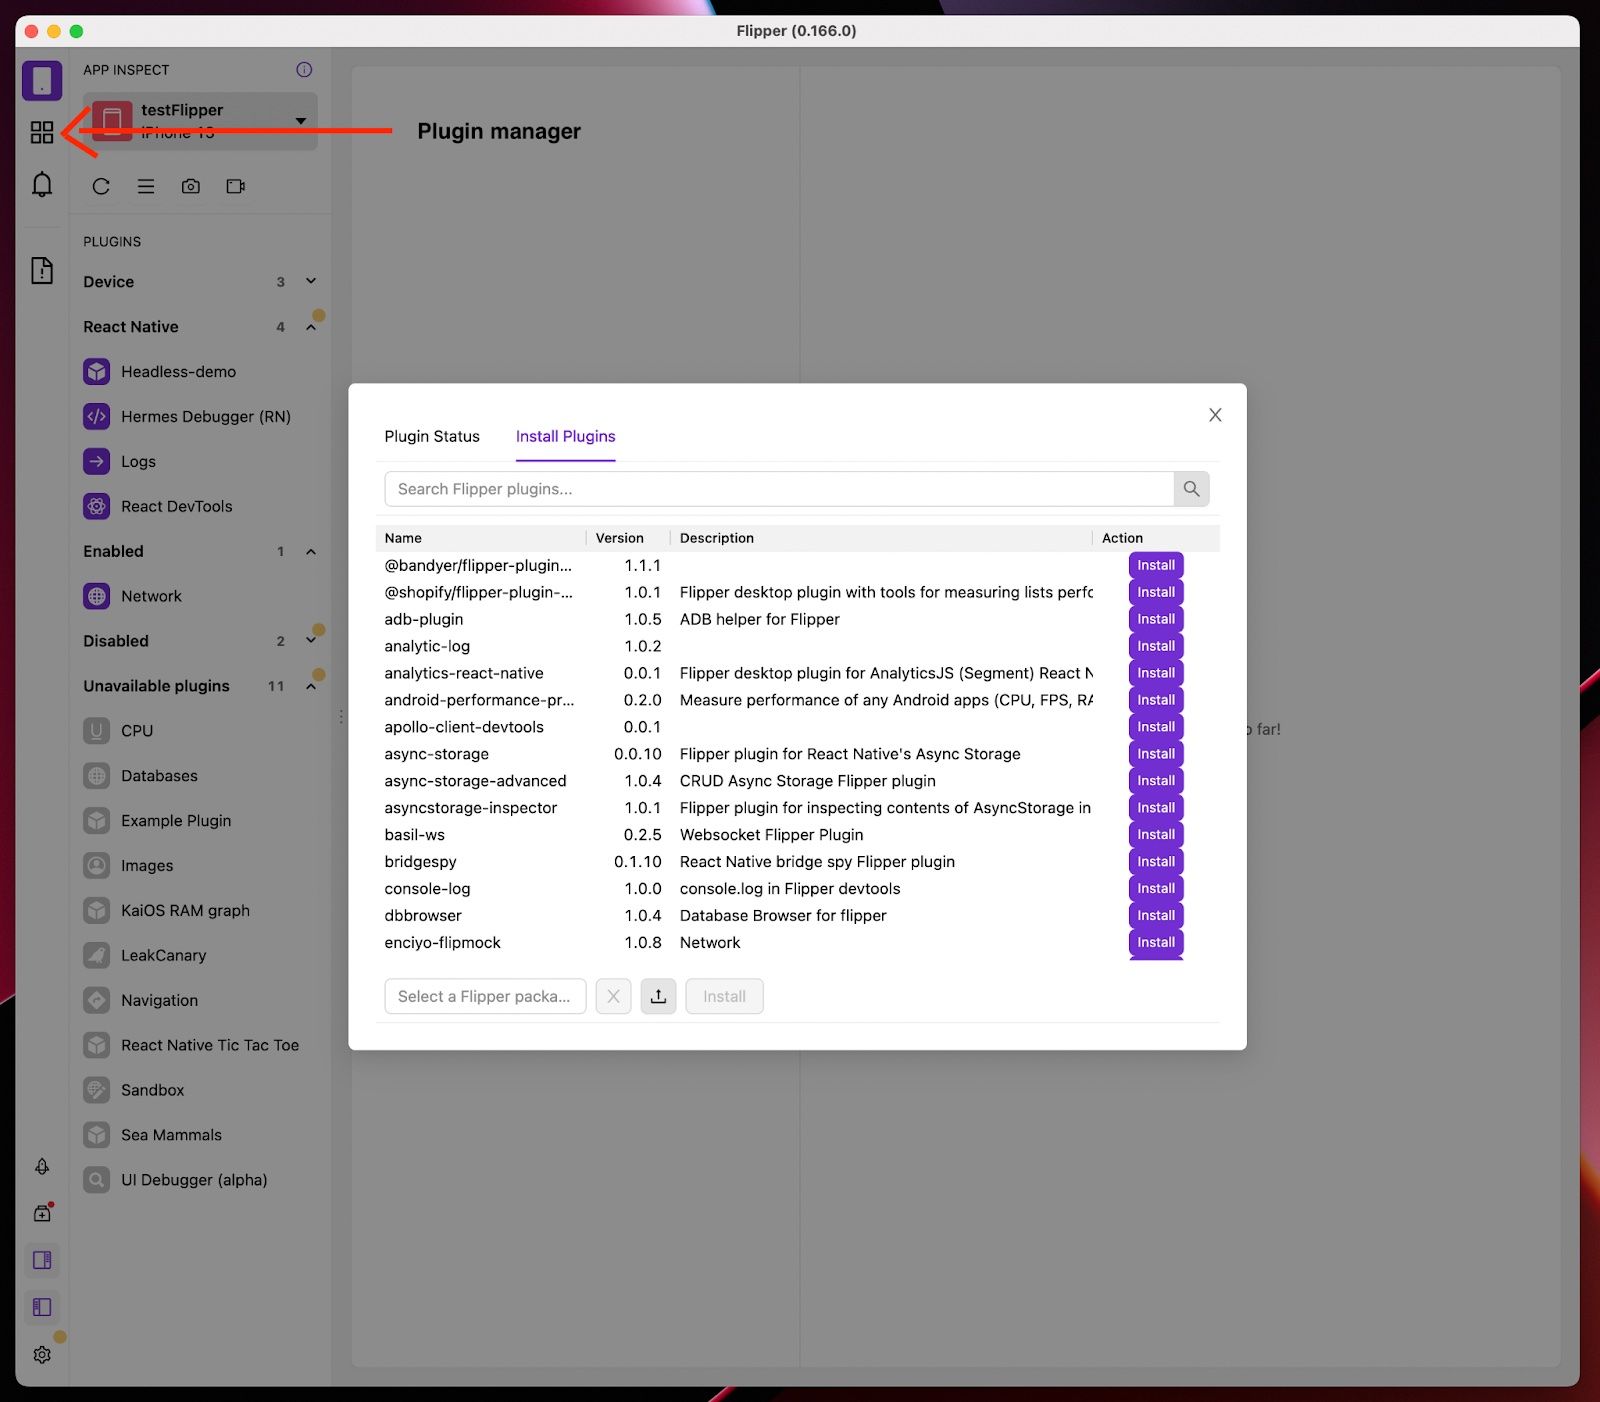
They are all plugins and pre-installed; therefore, you don’t need to spend time adding any. And that’s not all. To extend Flipper’s functionality, you can use Plugin Manager, a very similar system of plugins as we know from Visual Code or Chrome. By having an option to use other plugins or create your own easily, Flipper can become a super powerful tool.
Here are some commonly used plugins that you may also need:
- react-native-performance: It enables a new section where we can measure the app’s performance.
- redux-debugger: Helps with inspecting the Redux state.
- redux-inspector: Another redux state inspector.
- async-storage: Helps inspect any AsyncStorage-related calls (set, save, delete, etc).
Installing a New Plugin
The process of configuring a new plugin for your project is very easy:
- First, you need to find the package of that plugin and install it alongside
react-native-flipper. - Second, see the docs of each plugin to learn how to include it in your code since each plugin has a different configuration.
- The last step, install the plugin on your Flipper desktop.
Other Debugging Tools
Other tools are also popular for debugging React Native apps, for example, React Native Debugger and Reactron. How do they compare to Flipper?
React Native Debugger
The React Native Debugger is based on the official Remote Debugger and includes a redux inspector that allows you to inspect your state changes quickly.
It supports some of the features that are also included in Flipper, like Inspect layout and its props, Inspects Network request, Inspects Redux state, and others.
- Advantage: In my opinion, the only advantage is that you can add breakpoints and inspect code execution. That’s something that I couldn’t find in any Flipper plugins.
- Disadvantages: You cannot debug multiple devices/simulators simultaneously, and you cannot install other plugins like Flipper. Also, the other key disadvantage is that RND runs with Debug mode turned on, and it doesn’t execute your JS code in your device engine, so it uses Remote debugging.
Reactron
Reactron is another somehow great tool for debugging React Native apps.
- Advantage: It runs without debugger mode being turned on, so it doesn’t slow down your app.
- Disadvantage: Compared to Flipper, you cannot install other plugins with Reactron, which can sometimes limit your development process.
Reactron has a list of features, such as Inspect Redux state and Inspect Network calls. However, most are included in Flipper as well.
Ultimately, using Flipper makes it easier to develop mobile apps because of all its features and benefits:
- It comes with a lot of pre-installed tools, and you can either install new plugins or also create new ones, which gives Flipper limitless possibilities to help you fit in any use case.
- Flipper SDK comes pre-installed since the 0.62 version of React Native, making its configuration straightforward.
- It makes your app work fast when you are debugging, compared to other tools that use Remote debugging.
